Monitoring Servers and Services with Prometheus Stack and Send Alerts
Posted By : Avinash Singh | 30-Nov-2021
ERP

Let's first get some Introduction to Prometheus Stack, comprising Prometheus, Grafana, Alert manager, Cadvisor, and the Node Exporter.
Prometheus => Prometheus is an open-source monitoring solution backed by The Linux Foundation. Prometheus collects metrics from registered targets and stores them in its time series database and provides PromQL query language, which we can use to query from its collected metrics. We can set targets and rules in the Prometheus configuration file, according to which, It will send data to alert managers to publish alerts and can be easily integrated with Grafana to visualize metrics in Graphical view.
Alert Manager => The Alert manager is part of Prometheus open-source distributions, It handles alerts sent by the Prometheus server. It can group alerts and route them to the correct receiver medium like email, slack, PagerDuty.
Cadvisor => It is an open-source product by google. It monitors the container health and its metrics and can be easily integrated with Prometheus.
Node Exporter => It is a metrics collector which needs to be setup on all nodes which needs to be monitored, It collect system metrics like disk usage, memory information and other details and exports all metrics on an endpoint '/metrics', which can be pulled and collected by Prometheus.
Grafana => It is an open-source visualization and analytics tool. Grafana allows you to query, visualize, alerts on data received from data sources like Prometheus and provide a beautiful dashboard which can be easily imported and give all data in beautiful charts.
It is time for demo and see whole setup in working
Note:- For the demonstration purpose, I have also taken a Django service , PostgresSQL Database and Optaplanner service, and monitoring them, you can skip these services, to avoid any confusion, and for learning purpose, you can simply just focus on node exporter service.
Step 1:- create 2 servers, or have 2 machines in your local setup, such that both can connect with each other.
|
|
|
|
|
|
|
|
|
|
|
|
|
|
|
Step 2:- Allow these ports in security group or your firewall settings
|
|
|
|
|
|
|
|
|
|
|
|
|
|
|
|
|
|
|
|
|
|
|
|
|
|
|
|
|
|
Step 3:- Installing docker and docker-compose on amazon2 linux server
sudo yum update -y
sudo amazon-linux-extras install docker -y
sudo service docker start
sudo usermod -a -G docker ec2-user
sudo curl -L "https://github.com/docker/compose/releases/download/1.29.2/docker-compose-$(uname -s)-$(uname -m)" -o /usr/local/bin/docker-compose
sudo chmod +x /usr/local/bin/docker-compose
sudo ln -s /usr/local/bin/docker-compose /usr/bin/docker-compose
Step 4:- Create Directory for Prometheus and modify file permissions
sudo mkdir -p /opt/docker/monitoring
sudo chown ec2-user:ec2-user /opt/docker/monitoring -R
Step 5:- Now we will create docker compose files for all services individually, and then combine them
- Prometheus
prometheus:
image: prom/prometheus
container_name: prometheus
ports:
- '9090:9090'
command:
- '--config.file=/etc/prometheus/prometheus.yml' # this file contains , target information, what endpoint to monitor
volumes:
- './prometheus/prometheus.yml:/etc/prometheus/prometheus.yml:ro'
- './prometheus/alert_rules.yml:/etc/prometheus/alert_rules.yml' # this file comprises rules to check with metrics, received
networks:
- monitoring
we will store, target information (what service to monitor at which endpoint, at what interval) in prometheus.yml
global:
scrape_interval: 10s
scrape_timeout: 5s
evaluation_interval: 15s
scrape_configs:
- job_name: 'prometheus-docker-service'
honor_timestamps: true
static_configs:
- targets: ['localhost:9090'] # prometheus monitoring itself
- job_name: 'prometheus-monitoring-server'
static_configs:
- targets: ['node-exporter:9100'] # monitoring node exporter of prometheus node
- job_name: app-optaplanner-container
metrics_path: /actuator/prometheus
scheme: http
static_configs:
- targets:
- 10.12.1.203:8888 # here our target is optaplanner java service, exposing its metrics on port 8888
Prometheus regularly check, whether all services are running as expected based on some predefined conditions, these conditions are defined in alert_rules.yml
groups:
- name: alert.rules
rules:
- alert: InstanceDown
# Condition for alerting
expr: up == 0
for: 2m
annotations:
title: 'Instance {{ $labels.instance }} down'
description: '{{ $labels.instance }} of job name {{ $labels.job }} has been down for more than 2 minutes.'
labels:
severity: 'critical'
- alertmanager
alertmanager:
image: prom/alertmanager
ports:
- '9093:9093'
container_name: alertmanager
restart: always
volumes:
- './alertmanager/:/etc/alertmanager/'
command:
- '--config.file=/etc/alertmanager/config.yml'
networks:
- monitoring
If any service goes down, or not able to give response to prometheus, then alerts needs to be send, config.yml file contain , all information needed to send alerts via mail
global:
resolve_timeout: 2m
route:
receiver: 'email-notifications'
receivers:
- name: 'email-notifications'
email_configs:
- to: '[email protected],[email protected]'
from: '[email protected]'
smarthost: smtp.gmail.com:587
auth_username: '[email protected]'
auth_identity: '[email protected]'
auth_password: 'enter your passowrd'
send_resolved: true
- cadvisor
cadvisor:
image: google/cadvisor
container_name: cadvisor
ports:
- '8080:8080'
volumes:
- '/:/rootfs:ro'
- '/var/run:/var/run:rw'
- '/sys:/sys:ro'
- '/var/lib/docker/:/var/lib/docker:ro'
networks:
- monitoring
- Node Exporter
node-exporter:
image: prom/node-exporter
container_name: node-exporter
volumes:
- '/proc:/host/proc:ro'
- '/sys:/host/sys:ro'
- '/:/rootfs:ro'
command:
- '--path.procfs=/host/proc'
- '--path.sysfs=/host/sys'
- '--collector.filesystem.ignored-mount-points'
- ^/(sys|proc|dev|host|etc|rootfs/var/lib/docker/containers|rootfs/var/lib/docker/overlay2|rootfs/run/docker/netns|rootfs/var/lib/docker/aufs)($$|/)
ports:
- '9100:9100'
networks:
- monitoring
- grafana
grafana:
image: grafana/grafana
depends_on:
- prometheus
ports:
- '3000:3000'
volumes:
- 'grafana_data:/var/lib/grafana'
- ./grafana:/etc/grafana/provisioning/datasources
container_name: grafana
environment:
- GF_SECURITY_ADMIN_PASSWORD=erpsolutions.oodles.io
networks:
- monitoring
Now we need to put all service in a single compose file, and make the service up
docker-compose.yml
version: '3'
services:
prometheus:
.
. # take code from above prometheus block
.
cadvisor:
.
. # take code from above cadvisor block
.
alertmanager:
.
. # take code from above alertmanager block
.
node-exporter:
.
. # take code from above node-exporter block
.
grafana:
.
. # take code from above grafana block
.
networks:
monitoring:
external: true
volumes:
grafana_data: {}
our next task is login on all server, which needs to be monitored, and run node-exporter container service on them
and at last, on the prometheus server, we will make pull all defined docker images and bring the docker-compose setup up
docker-compose -f /opt/docker/monitoring/docker-compose.yml up -d
Prometheus Service HomePage
http://ip_address_of_server:9090

To go to target section -> prometheus main page -> status > targets

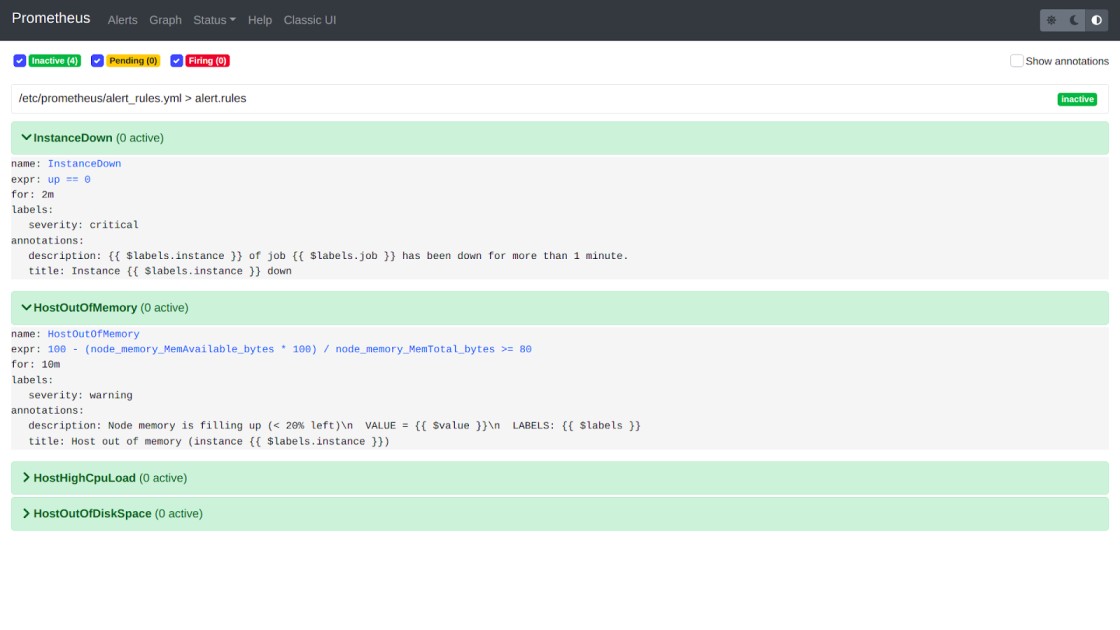
Rules Page, To go to rules section -> prometheus main page -> status > rules
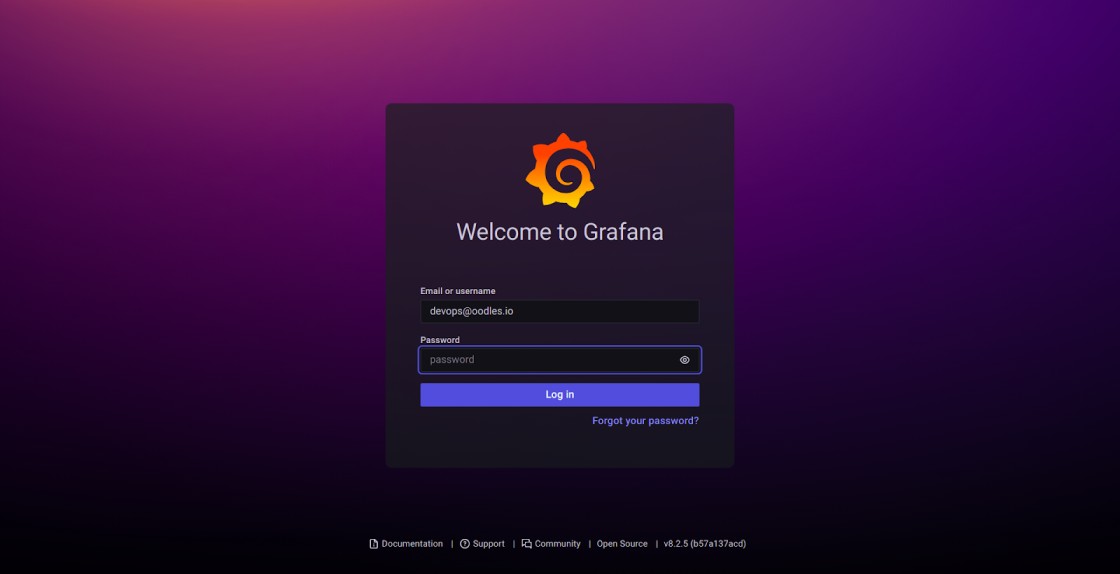
Grafana Service Homepage
http://ip_address_of_server:9090

To Import any new dashboard, you can go to this page.
Grafana Home -> Dashboard -> Manage -> Import -> Enter Dashboard Id, Or Paste Dashboard Json Data
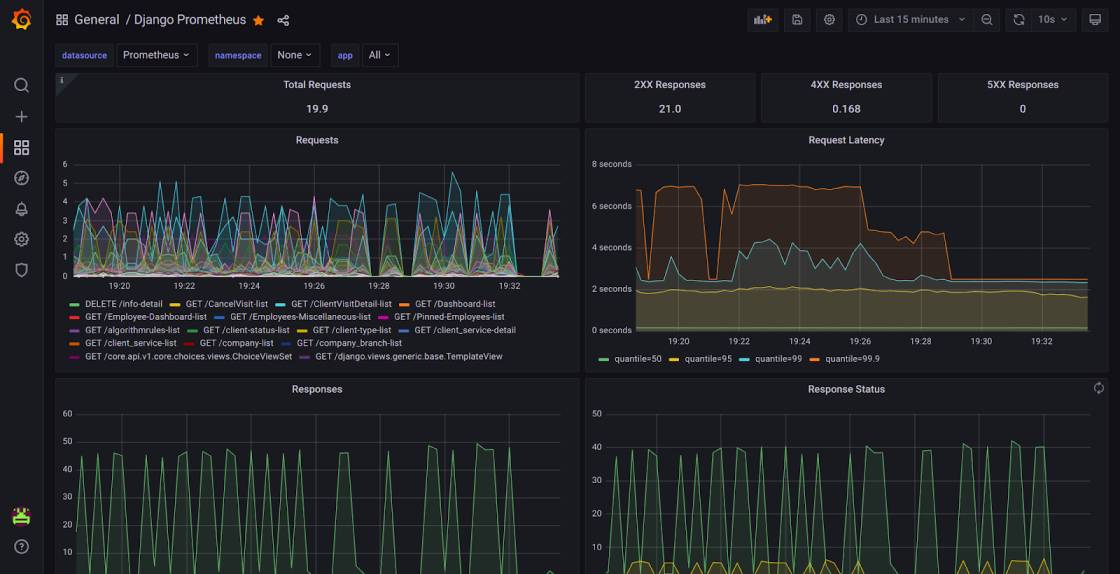
Here are some beautiful Dashboards
PostgresSQL Database Metrics

Node Exporter Dashboard

Django Dashboard
If any of our server, which have node exporter configured and connected with prometheus goes down, we will recieve email alerts

Conclusion => We have set up Prometheus stack, and are now able to monitor the status of our service and servers , and will get alerts, if any service is not stable.
We are a prominent ERP development company that provides 360-degree enterprise solutions for diverse business needs of our clients. Our seasoned developers use the latest tech stack and development tools to build scalable business applications with custom features. For more information, contact us at [email protected].